



How to Measure UGC Performance: A Guide to Conversion Metrics
How to Measure UGC Performance: A Guide to Conversion Metrics
Views don't tell you if UGC is working. Here's a breakdown of the conversion metrics that actually connect UGC performance to business results
Published:

Read Time:

4 min

Written by:
Fawwaz
Trend Research and Copywriter
NO ONE KNOWS IF THE CAMPAIGN WAS ACTUALLY SUCCESSFUL
A UGC campaign generating one million views looked fantastic in the report and pleased the stakeholders. But when someone asked how many people actually clicked or bought something, no one had a clear answer.
NO ONE KNOWS IF THE CAMPAIGN WAS ACTUALLY SUCCESSFUL
A UGC campaign generating one million views looked fantastic in the report and pleased the stakeholders. But when someone asked how many people actually clicked or bought something, no one had a clear answer.
NO ONE KNOWS IF THE CAMPAIGN WAS ACTUALLY SUCCESSFUL
A UGC campaign generating one million views looked fantastic in the report and pleased the stakeholders. But when someone asked how many people actually clicked or bought something, no one had a clear answer.
Measuring campaign success has been a challenge for many brands, and this challenge has only grown after major changes to platform metrics. As a result, many brands compare numbers that no longer have the same meaning, with dashboards that may indicate growth but don't guarantee actual performance improvement.
Impressions and likes are easy to collect, but they reflect attention, not results. This article focuses on the metrics that truly connect UGC performance to business outcomes: conversion metrics.
Metrics You Should Stop Using as Your Main Benchmark
Views, likes, and impressions matter because the problem is not the metric themselves but using these metrics as primary success indicators.
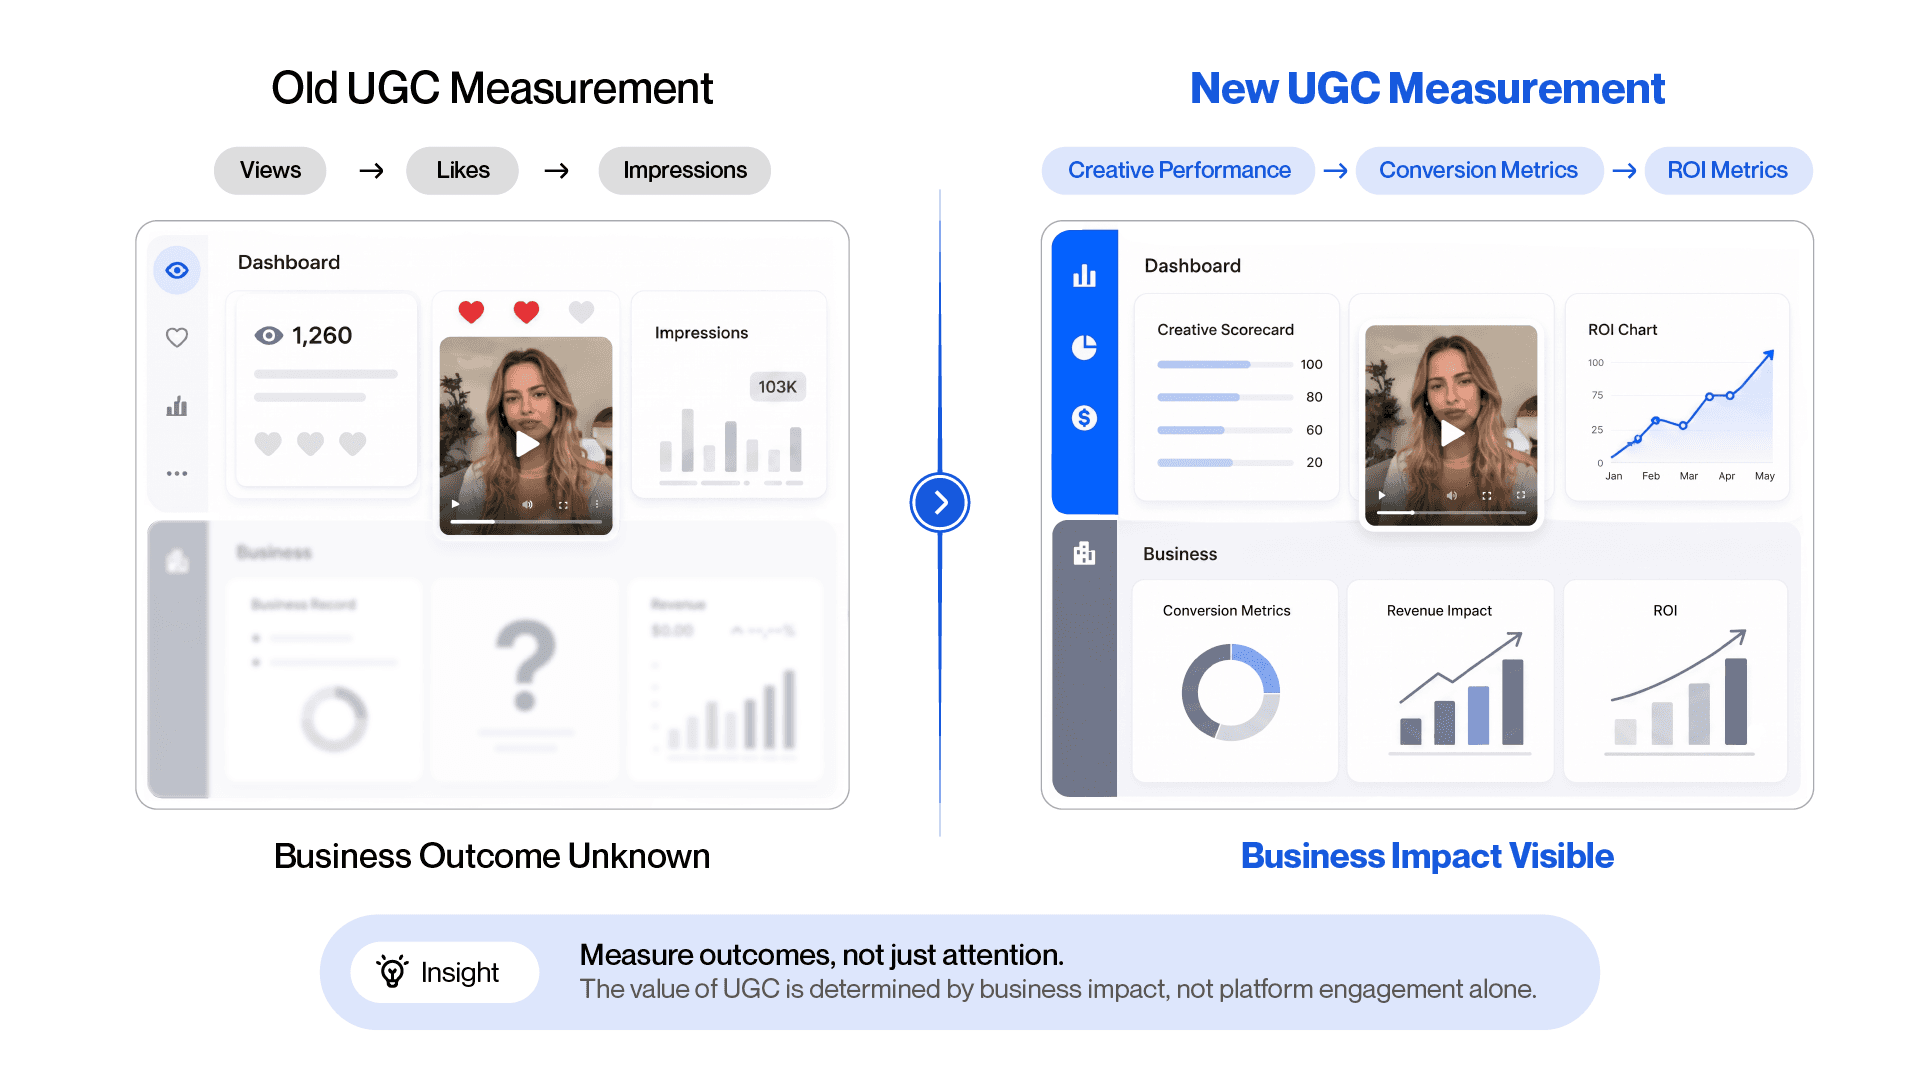
A report showing 2 million views, with 150,000 likes and 500,000 impressions, cannot guarantee that your campaign was successful. These numbers mean nothing if no audience members clicked or made a purchase. They merely appear to be a false sense of success that has absolutely no impact on your company’s revenue.
This distinction matters more now than it did two years ago. In March 2025, YouTube Shorts changed how views are counted, starting from the moment a Short begins playing rather than after a certain watch threshold. A month later, Instagram replaced several metrics including Reel plays with a broader "Views" figure that counts repeated exposures from the same user. As a result, brands comparing this year's numbers to last year's are not always comparing the same things, even when the dashboard shows growth.
Brands that rely on these numbers as their primary benchmark often focus on campaigns that appear successful rather than those that actually deliver results. This is one reason many brands waste money on their UGC strategies without improving performance because they measure visibility, not impact.
The Creative Performance Metrics
Before measuring whether a UGC video generates conversions, there is a prior question worth answering: are people actually watching it?
Creative performance metrics answer this question. They are the earliest signal available for whether a piece of content is worth investing further budget behind.
Three-Second Hold RateThis is the first metric to measure what percentage of viewers are still watching at the three-second mark. In short-form content, the first three seconds determine whether the hook worked. If most viewers leave before this point, no conversion metric further down the funnel matters because the audience never made it there. |
Hook Retention RateThis metric tracks how many viewers stay through the opening segment of the video. This is different from the three-second mark because it covers the full setup before the main message begins. A high hook retention rate means the opening generated enough curiosity or relevance to keep people watching. |
Completion RateThis metric measures how many viewers watched the entire video. A high completion rate indicates that the content offers enough value to the audience to sustain their interest until the end. |
Replay RateThis metric tracks viewers who voluntarily watched the video again. When viewers voluntarily watch a video again, it often signals exceptionally strong creative performance that’s worth developing further. |
The Conversion Metrics
This is where content performance connects to business behavior. Conversion metrics answer a different question from creative metrics: did watching the video make the viewer do something?
Click-Through Rate (CTR)CTR measures the percentage of people who saw the content and clicked through to the next step, whether that is a product page, a landing page, or a sign-up form. In the context of UGC, CTR works differently depending on how the content is distributed. For paid UGC running as an ad on Meta or TikTok, CTR is straightforward: clicks divided by impressions, visible directly in the ad account. For organic UGC posted by creators on their own accounts, CTR needs to be inferred through other signals like link-in-bio clicks, swipe-up actions on Stories, or comment-to-DM triggers. A useful CTR benchmark for UGC ads on Meta sits between 1% and 3% for most consumer categories. Below 1% typically signals a hook or creative problem. Above 3% is a strong signal worth examining for what drove it. |
Cost Per Click (CPC)CPC measures how much is spent for each click generated. It is relevant primarily for paid UGC campaigns and helps brands understand distribution efficiency across different creative assets. When comparing multiple UGC videos running simultaneously in an ad account, CPC is one of the clearest ways to identify which creative is generating traffic most efficiently. A video with a low CPC and a reasonable CTR is a candidate for scaling. A video with a high CPC despite strong views is often a targeting issue rather than a creative one. |
Cost Per Acquisition (CPA)CPA is the conversion metric closest to a business outcome. It measures how much was spent in total to produce one customer, subscriber, install, or purchase, depending on the campaign objective. For UGC specifically, CPA needs to account for the full cost of the content, not just the media spend. If a brand paid a creator $300 for a video and spent $2,000 distributing it to generate 50 purchases, the actual CPA is $46, not $40. Excluding content production costs from CPA calculations produces figures that look better than reality. CPA also varies significantly by category. An app install campaign will have a very different CPA target than a skincare product purchase. The useful benchmark is not an industry average but the brand's own historical baseline, measured consistently over time. |
How to Set Up Tracking That Actually Works
Conversion metrics are only reliable when the tracking underneath them is configured correctly. Without proper tracking, the numbers exist but cannot be attributed to specific creators or specific pieces of content.
UTM Parameters
UTM parameters are tags added to URLs that tell analytics tools where traffic came from. For example, a link in a creator's bio might have a UTM that reads utm_source=instagram&utm_medium=ugc&utm_campaign=july2026&utm_content=creator_name. When that link is clicked, the analytics platform records the source.
For UGC campaigns, the most useful setup assigns unique UTM parameters per creator and per content asset. This makes it possible to compare performance across creators rather than seeing all UGC traffic lumped together.
In UGC, UTM links placement differs by platform, but the tracking logic is the same.
TikTok | Instagram Reels | YouTube Shorts |
In the creator's bio or in TikTok Shop product cards. | In the bio link, a Story swipe-up, or a comment-to-DM flow that sends the link directly. | Inside the video description. |
Affiliate Links and Creator-Specific Codes
An alternative to UTM tracking is giving each creator a unique affiliate link or discount code. When a viewer uses the code or clicks the link, the sale is attributed to that creator.
This approach is simpler to implement and does not require analytics platform access. It also creates an incentive structure: creators with affiliate arrangements earn from conversions, not just from posting fees, which often improves content quality.
How this works across platforms differs slightly. On TikTok, affiliate links can be embedded directly in TikTok Shop product cards. On Instagram, creators typically place them in the bio link or send them via DM automation. On YouTube, they go in the pinned comment or video description. A more detailed breakdown of affiliate structures per platform will be covered separately.
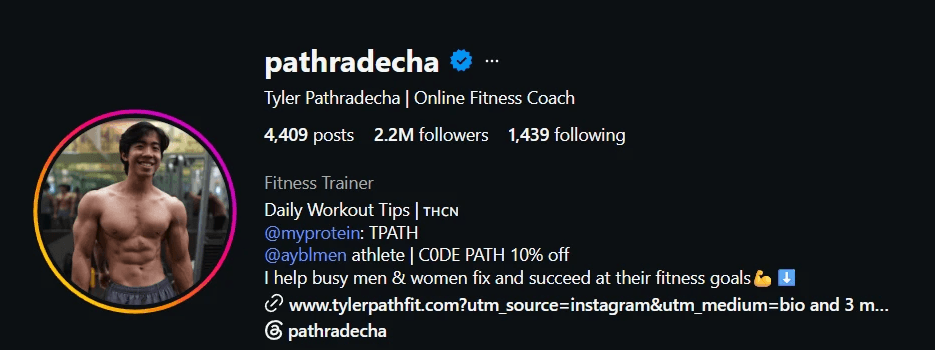
🔗 pathradecha instagram profile

Why Most Brands Misattribute UGC Performance
One thing worth understanding before drawing conclusions from conversion metrics: most UGC campaigns involve multiple touchpoints before a purchase.
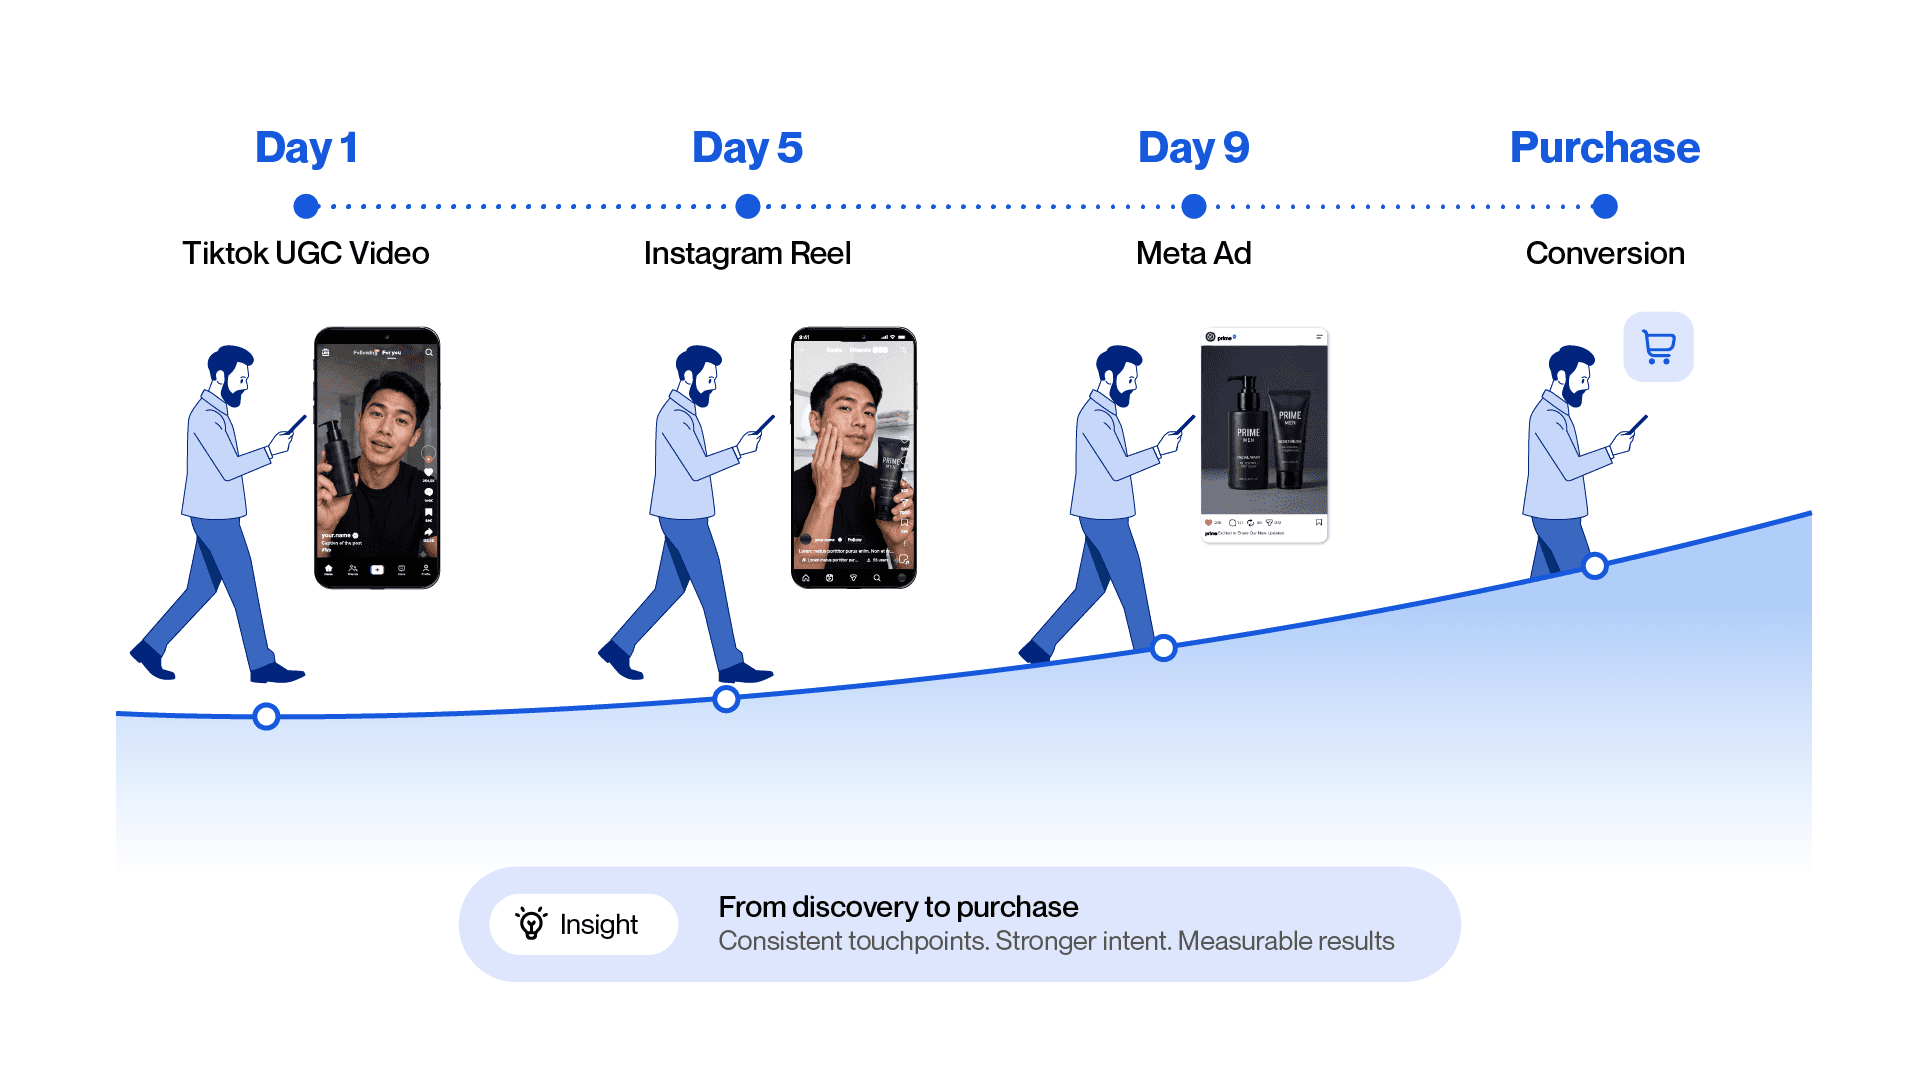
A viewer might see a TikTok UGC video on Day 1, come across an Instagram Reel from a different creator on Day 5, and then convert after seeing a retargeting ad on Day 9. If only the last interaction is credited with the purchase, the TikTok and Instagram content appear to have zero impact, even though they built the intent that made the final conversion possible.
This does not mean the tracking system is broken. It means the numbers should be read with this limitation in mind. When organic UGC content generates strong creative metrics but low direct conversions, it does not necessarily mean the content is not working. It may be contributing to conversions that are credited elsewhere in the funnel.
The Shift That Makes Measurement Useful
Moving from views and likes to creative performance metrics and conversion metrics changes what a UGC report can tell you. Instead of describing how many people saw the content, it starts answering whether the content actually moved people toward a business outcome.
That shift makes it possible to optimize: to identify which creators drive the highest CTR, which hooks generate the strongest three-second hold rate, and which content types produce the lowest CPA. Without these metrics, the only available decision is to spend more or less. With them, the decision becomes what specifically to change.

This is one reason Masterhooks places significant emphasis on measurement alongside creative strategy. Strong UGC is not just content that gets attention. It is content that can be connected to business outcomes, tracked consistently, and improved over time.
Want to understand how your current UGC campaign tracking holds up?

Want to understand how your current UGC campaign tracking holds up?
Measuring campaign success has been a challenge for many brands, and this challenge has only grown after major changes to platform metrics. As a result, many brands compare numbers that no longer have the same meaning, with dashboards that may indicate growth but don't guarantee actual performance improvement.
Impressions and likes are easy to collect, but they reflect attention, not results. This article focuses on the metrics that truly connect UGC performance to business outcomes: conversion metrics.
Metrics You Should Stop Using as Your Main Benchmark
Views, likes, and impressions matter because the problem is not the metric themselves but using these metrics as primary success indicators.
A report showing 2 million views, with 150,000 likes and 500,000 impressions, cannot guarantee that your campaign was successful. These numbers mean nothing if no audience members clicked or made a purchase. They merely appear to be a false sense of success that has absolutely no impact on your company’s revenue.
This distinction matters more now than it did two years ago. In March 2025, YouTube Shorts changed how views are counted, starting from the moment a Short begins playing rather than after a certain watch threshold. A month later, Instagram replaced several metrics including Reel plays with a broader "Views" figure that counts repeated exposures from the same user. As a result, brands comparing this year's numbers to last year's are not always comparing the same things, even when the dashboard shows growth.
Brands that rely on these numbers as their primary benchmark often focus on campaigns that appear successful rather than those that actually deliver results. This is one reason many brands waste money on their UGC strategies without improving performance because they measure visibility, not impact.
The Creative Performance Metrics
Before measuring whether a UGC video generates conversions, there is a prior question worth answering: are people actually watching it?
Creative performance metrics answer this question. They are the earliest signal available for whether a piece of content is worth investing further budget behind.
Three-Second Hold RateThis is the first metric to measure what percentage of viewers are still watching at the three-second mark. In short-form content, the first three seconds determine whether the hook worked. If most viewers leave before this point, no conversion metric further down the funnel matters because the audience never made it there. |
Hook Retention RateThis metric tracks how many viewers stay through the opening segment of the video. This is different from the three-second mark because it covers the full setup before the main message begins. A high hook retention rate means the opening generated enough curiosity or relevance to keep people watching. |
Completion RateThis metric measures how many viewers watched the entire video. A high completion rate indicates that the content offers enough value to the audience to sustain their interest until the end. |
Replay RateThis metric tracks viewers who voluntarily watched the video again. When viewers voluntarily watch a video again, it often signals exceptionally strong creative performance that’s worth developing further. |
The Conversion Metrics
This is where content performance connects to business behavior. Conversion metrics answer a different question from creative metrics: did watching the video make the viewer do something?
Click-Through Rate (CTR)CTR measures the percentage of people who saw the content and clicked through to the next step, whether that is a product page, a landing page, or a sign-up form. In the context of UGC, CTR works differently depending on how the content is distributed. For paid UGC running as an ad on Meta or TikTok, CTR is straightforward: clicks divided by impressions, visible directly in the ad account. For organic UGC posted by creators on their own accounts, CTR needs to be inferred through other signals like link-in-bio clicks, swipe-up actions on Stories, or comment-to-DM triggers. A useful CTR benchmark for UGC ads on Meta sits between 1% and 3% for most consumer categories. Below 1% typically signals a hook or creative problem. Above 3% is a strong signal worth examining for what drove it. |
Cost Per Click (CPC)CPC measures how much is spent for each click generated. It is relevant primarily for paid UGC campaigns and helps brands understand distribution efficiency across different creative assets. When comparing multiple UGC videos running simultaneously in an ad account, CPC is one of the clearest ways to identify which creative is generating traffic most efficiently. A video with a low CPC and a reasonable CTR is a candidate for scaling. A video with a high CPC despite strong views is often a targeting issue rather than a creative one. |
Cost Per Acquisition (CPA)CPA is the conversion metric closest to a business outcome. It measures how much was spent in total to produce one customer, subscriber, install, or purchase, depending on the campaign objective. For UGC specifically, CPA needs to account for the full cost of the content, not just the media spend. If a brand paid a creator $300 for a video and spent $2,000 distributing it to generate 50 purchases, the actual CPA is $46, not $40. Excluding content production costs from CPA calculations produces figures that look better than reality. CPA also varies significantly by category. An app install campaign will have a very different CPA target than a skincare product purchase. The useful benchmark is not an industry average but the brand's own historical baseline, measured consistently over time. |
How to Set Up Tracking That Actually Works
Conversion metrics are only reliable when the tracking underneath them is configured correctly. Without proper tracking, the numbers exist but cannot be attributed to specific creators or specific pieces of content.
UTM Parameters
UTM parameters are tags added to URLs that tell analytics tools where traffic came from. For example, a link in a creator's bio might have a UTM that reads utm_source=instagram&utm_medium=ugc&utm_campaign=july2026&utm_content=creator_name. When that link is clicked, the analytics platform records the source.
For UGC campaigns, the most useful setup assigns unique UTM parameters per creator and per content asset. This makes it possible to compare performance across creators rather than seeing all UGC traffic lumped together.
In UGC, UTM links placement differs by platform, but the tracking logic is the same.
TikTok | Instagram Reels | YouTube Shorts |
In the creator's bio or in TikTok Shop product cards. | In the bio link, a Story swipe-up, or a comment-to-DM flow that sends the link directly. | Inside the video description. |
Affiliate Links and Creator-Specific Codes
An alternative to UTM tracking is giving each creator a unique affiliate link or discount code. When a viewer uses the code or clicks the link, the sale is attributed to that creator.
This approach is simpler to implement and does not require analytics platform access. It also creates an incentive structure: creators with affiliate arrangements earn from conversions, not just from posting fees, which often improves content quality.
How this works across platforms differs slightly. On TikTok, affiliate links can be embedded directly in TikTok Shop product cards. On Instagram, creators typically place them in the bio link or send them via DM automation. On YouTube, they go in the pinned comment or video description. A more detailed breakdown of affiliate structures per platform will be covered separately.
🔗 pathradecha instagram profile
Why Most Brands Misattribute UGC Performance
One thing worth understanding before drawing conclusions from conversion metrics: most UGC campaigns involve multiple touchpoints before a purchase.
A viewer might see a TikTok UGC video on Day 1, come across an Instagram Reel from a different creator on Day 5, and then convert after seeing a retargeting ad on Day 9. If only the last interaction is credited with the purchase, the TikTok and Instagram content appear to have zero impact, even though they built the intent that made the final conversion possible.
This does not mean the tracking system is broken. It means the numbers should be read with this limitation in mind. When organic UGC content generates strong creative metrics but low direct conversions, it does not necessarily mean the content is not working. It may be contributing to conversions that are credited elsewhere in the funnel.
The Shift That Makes Measurement Useful
Moving from views and likes to creative performance metrics and conversion metrics changes what a UGC report can tell you. Instead of describing how many people saw the content, it starts answering whether the content actually moved people toward a business outcome.
That shift makes it possible to optimize: to identify which creators drive the highest CTR, which hooks generate the strongest three-second hold rate, and which content types produce the lowest CPA. Without these metrics, the only available decision is to spend more or less. With them, the decision becomes what specifically to change.
This is one reason Masterhooks places significant emphasis on measurement alongside creative strategy. Strong UGC is not just content that gets attention. It is content that can be connected to business outcomes, tracked consistently, and improved over time.
Want to understand how your current UGC campaign tracking holds up?
Related Reading

How Blumhouse Built a $740M Horror Franchise by Spending Less Than Any Competitor
4 min
|

How to Find & Choose the Right Influencer for Your Brand (Without Getting Burned)
5 min
|

What Is Influencer Marketing? A No-Fluff Guide for Brands Ready to Actually Use It
5 min
|



Need help scaling?
Book a strategy call with our expert team to audit your current UGC setup.
Related Reading
How Blumhouse Built a $740M Horror Franchise by Spending Less Than Any Competitor
How Blumhouse turned low-budget horror into a repeatable franchise model using controlled costs, social amplification, and audience-driven content.
4 min
|
How Blumhouse Built a $740M Horror Franchise by Spending Less Than Any Competitor
How Blumhouse turned low-budget horror into a repeatable franchise model using controlled costs, social amplification, and audience-driven content.
4 min
|
How to Find & Choose the Right Influencer for Your Brand (Without Getting Burned)
Learn how to find influencers for your brand using audience fit, engagement quality, growth patterns, content quality, and campaign history.
5 min
|
How to Find & Choose the Right Influencer for Your Brand (Without Getting Burned)
Learn how to find influencers for your brand using audience fit, engagement quality, growth patterns, content quality, and campaign history.
5 min
|
What Is Influencer Marketing? A No-Fluff Guide for Brands Ready to Actually Use It
Ready to use influencer marketing for your brands? Learn influencer types, campaign models, costs, ROI, measurement, and how to choose the right creators.
5 min
|
What Is Influencer Marketing? A No-Fluff Guide for Brands Ready to Actually Use It
Ready to use influencer marketing for your brands? Learn influencer types, campaign models, costs, ROI, measurement, and how to choose the right creators.
5 min
|