
The UGC Testing Playbook: How to Know If Your Content Is Working Before You Scale
The UGC Testing Playbook: How to Know If Your Content Is Working Before You Scale
A practical UGC testing SOP covering hook rate, hold rate, CTR, CPA, decision rules, and a 4-week optimization calendar. Learn how to test and scale UGC now!
Published:

Read Time:

4 min

Written by:
Fawwaz
Trend Research and Copywriter
POSTING A LOT OF UGC WITHOUT KNOWING WHAT WORKS IS A WASTE
Wasting your budget that way will not scale your brand up, that is why figuring out which parts are truly effective is a very important thing to do. Proper testing starts with several variations of the hook, allowing enough time to collect data, and then gradually evaluating performance from attention, retention, clicks, to conversions.
POSTING A LOT OF UGC WITHOUT KNOWING WHAT WORKS IS A WASTE
Wasting your budget that way will not scale your brand up, that is why figuring out which parts are truly effective is a very important thing to do. Proper testing starts with several variations of the hook, allowing enough time to collect data, and then gradually evaluating performance from attention, retention, clicks, to conversions.
POSTING A LOT OF UGC WITHOUT KNOWING WHAT WORKS IS A WASTE
Wasting your budget that way will not scale your brand up, that is why figuring out which parts are truly effective is a very important thing to do. Proper testing starts with several variations of the hook, allowing enough time to collect data, and then gradually evaluating performance from attention, retention, clicks, to conversions.
Without this process, it’s difficult to analyze poor results. Is the problem with the hook, the content itself, the CTA, or is there simply not enough data? This guide provides a structured testing process so that every result can be used to determine the next steps.
The UGC Testing Rule
Before launching a batch, define what you are testing, how long you will test it, and what result will make you scale, iterate, or stop.
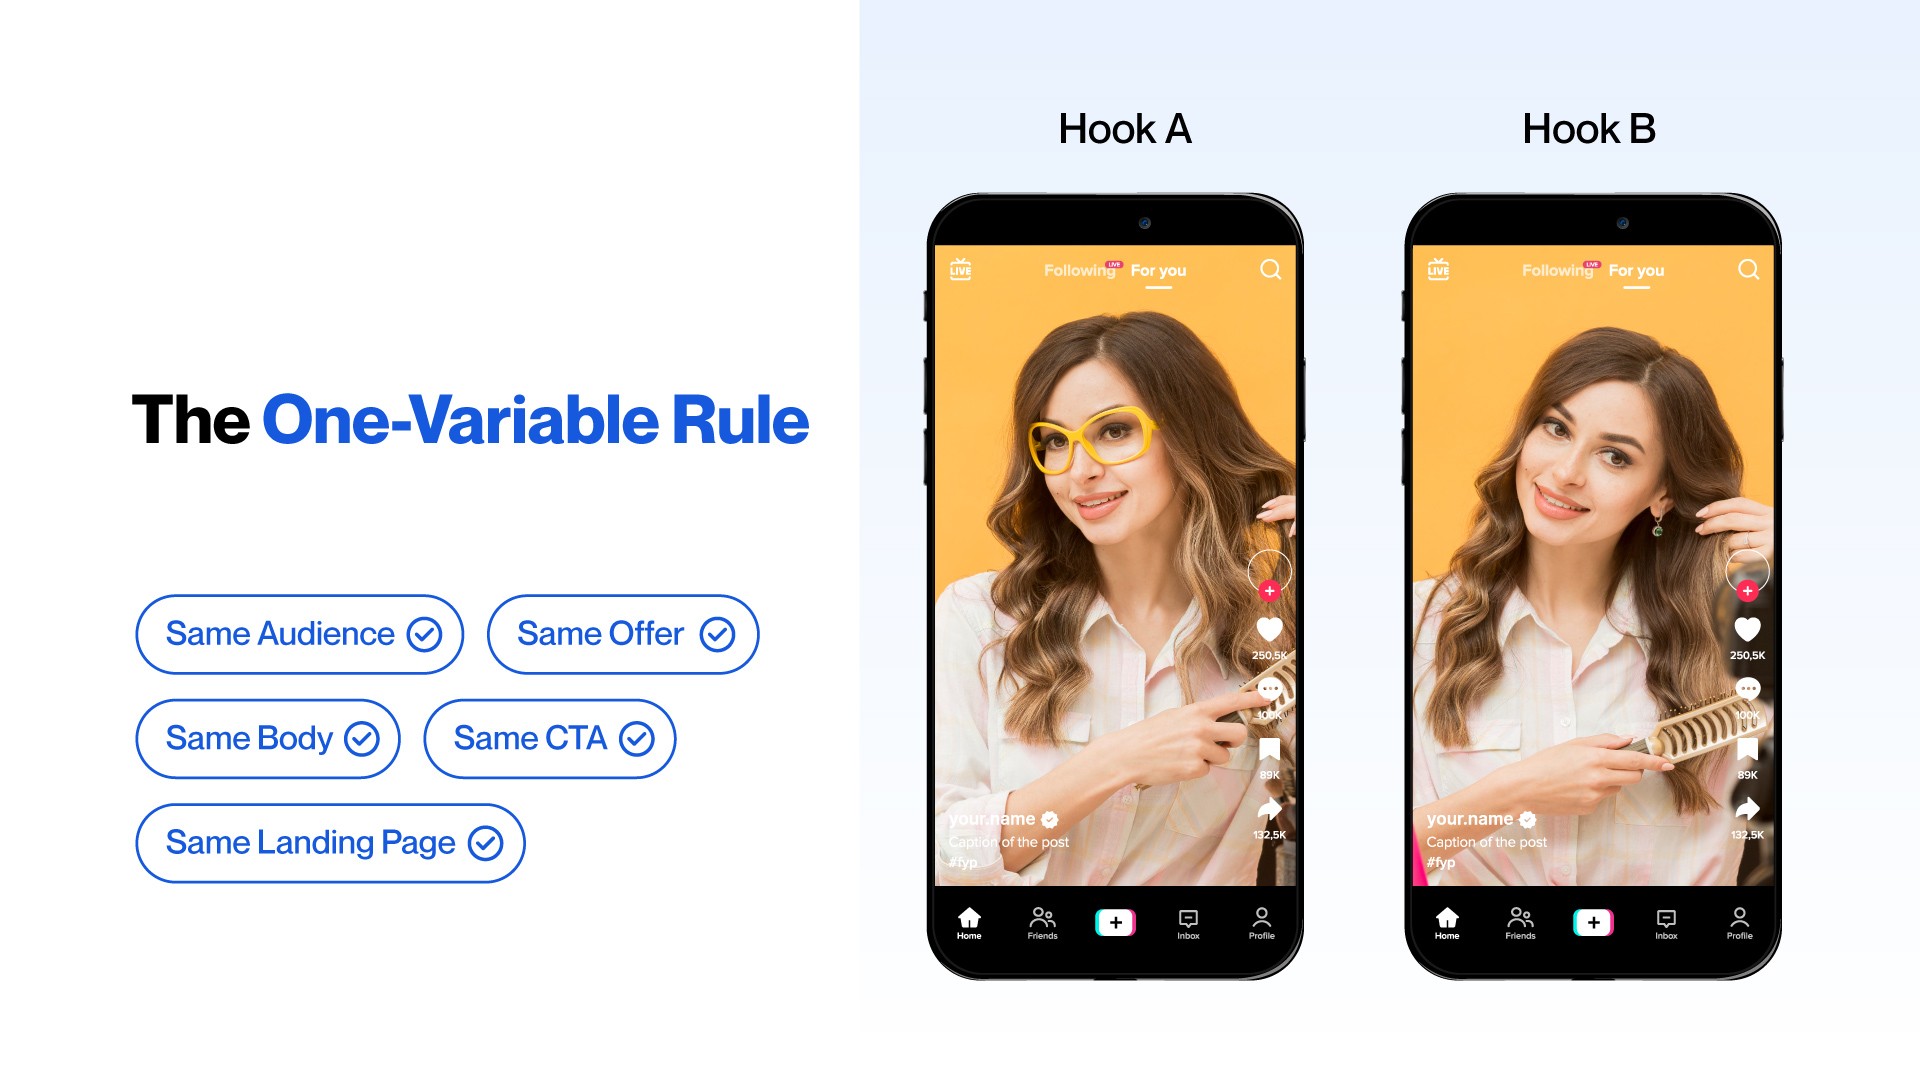
For a clear content A/B test, change one meaningful variable at a time. If Hook A and Hook B use the same body, audience, offer, and CTA, you can more easily see whether the hook caused the performance difference. Changing several elements at once makes the results harder to understand.
How Many UGC Variations Should You Test?
You can start with 2–4 hook variations per batch that is enough to create meaningful contrast without spreading a small budget across too many versions. For the first test:
Variable | Keep consistent |
Audience | Same |
Offer | Same |
Body | Same |
CTA | Same |
Landing page | Same |
Hook | Change this |
Once a winning hook emerges, move to the next layer by testing different bodies, then CTAs. This creates a clear progression and makes it easier to understand what is driving performance.
How Long Should a UGC Test Run?
For day-to-day creative optimization, 48–72 hours is a useful first review window. Use this time to identify early winners and losers, but do not treat 48 hours as a final statistical verdict.
For formal A/B testing, TikTok recommends running Split Tests for at least seven days to collect enough data. A practical approach is 48–72 hours for early creative diagnosis, then longer testing for formal conclusions.
The 4 Layers of UGC Testing
Do not jump straight to CPA because each of these layers answers a different question:
Layer 1: Did the Hook Stop the Scroll?
In the first 6–24 hours, check your 3-second hook rate, calculated as 3-second video views ÷ impressions × 100. This shows whether the opening is strong enough to make people stop and watch.
Working benchmark
Hook rate | Working interpretation | Action |
Below 25% | Weak opening | Rework the first 3 seconds |
25–29% | Baseline | Keep testing |
30%+ | Good | Continue evaluation |
35%+ | Strong scaling signal | Consider additional budget |
These bands are based on current practitioner benchmarks rather than an official Meta standard. Current 2026 sources generally place 25% around the working floor and 30–35% in the stronger range.
If the hook rate is weak, test the first sentence, opening visual, first frame, on-screen text, or initial action before reshooting the entire video. Fix the first three seconds first.
Layer 2: Did the Video Keep Attention?
At 24–48 hours, check whether the body keeps viewers engaged after the hook. A strong opening gets people into the video, while the 15-second hold rate shows whether the content delivers enough value to keep them watching.
Working benchmark
15%+ at 15 seconds = a useful retention signal
Treat these numbers as directional benchmarks, since 2026 datasets vary depending on how 15-second retention is calculated. Some place TikTok In-Feed retention around 12–20% and Meta Feed around 10–18%.
Hook | Hold | Diagnosis |
Low | Low | Opening likely needs work |
High | Low | Body loses the viewer |
High | High | Move to CTR |
Low | High | Re-test the opening before changing the body |
Consistency is the most important part. Use the same calculation and definition every week so your results stay comparable. A strong hold rate also means you do not need to rewrite the entire video if the hook is weak. Change the opening, keep the body, and preserve what already works.
Layer 3: Did the Viewer Want More?
Once the ad has enough impressions, check link CTR. CTR shows whether the creative creates enough interest for viewers to take the next step. For Meta UGC ads in consumer goods, 1–3% can be used as a directional benchmark, but results vary by account, industry, and campaign goal.
If you have a good hook + good hold + weak CTR, the problem may sit further down the ad. Check the product explanation, offer, CTA, value proposition, landing-page expectation, and audience-product fit before replacing the hook. The hook has already shown that it can earn attention.
Layer 4: Did It Actually Convert?
Once you have enough conversion data, look at CPA and ROAS. These are downstream metrics that show whether the creative is driving the business outcome the campaign was built to achieve.
For this testing framework, use 50 conversion events as a minimum working threshold before making a strong CPA or ROAS judgment. This is an operating guideline, not a universal platform requirement, since the right amount of data varies by platform, campaign, and account.
The key principle is not to kill a creative because CPA looks weak before you have enough conversion data to make that result meaningful.
The Testing Decision Tree
Use this after every testing cycle.
Result | Decision | What to do |
Hook <25% | Iterate | Recut first 3 seconds |
Hook 25–30% | Continue testing | Keep gathering signal |
Hook 30%+ | Promising | Evaluate hold and CTR |
Hold weak, hook strong | Iterate body | Keep winning hook |
Hold strong, CTR weak | Iterate CTA/body | Keep winning hook |
CPA within target | Scale | Increase budget gradually |
CPA 50%+ above target after 50 conversions | Pause | Replace or rebuild |
No improvement after 2 iterations | Kill | Move to new concept |
This prevents a common mistake, but you have to make sure to not solve a body problem by throwing away a winning hook.
When Should You Scale?
By using these five conditions together, you can scale when:
☑ Hook rate is 30%+ ☑ Hold rate reaches your defined benchmark ☑ CPA is below target | ☑ Performance remains stable for 3 consecutive days ☑ Conversion data is sufficient to support the decision |
The 35% hook-rate threshold in the original framework can be treated as a stronger scaling signal, with current 2026 practitioner data generally placing 30–35% in the good-to-strong range for Meta video creative.
When Should You Iterate?
Iterate when the problem is isolated.
Scenario 1Hook rate <25% Change only the opening. Try:
Keep the rest of the video. | Scenario 2Hook rate is strong + hold rate is weak The opener worked, but the body did not. Look for:
Keep the winning hook. |
Scenario 3Hook rate is strong + hold rate is strong + CTR is weak The viewer stayed, but they did not want to click. Look at:
This is a different problem from the hook. |
When Should You Kill a Creative?
Use a stricter threshold for deciding when to pause a creative. Pause when CPA is 50% or more above target after 50 conversion events, or when two meaningful iterations show no improvement.
This helps avoid two costly mistakes: killing promising creative too early and wasting media budget on weak creative for too long.
Watch for Creative FatigueA winning UGC ad can eventually stop performing, even if the concept is still strong. The audience may simply have seen it too many times. For high-frequency campaigns, 7–10 days can be a useful reminder to review the creative, but the actual refresh should depend on spend, audience size, frequency, CTR, and CPA. Use the calendar as a reminder, not a rule. Let performance data tell you when the creative needs to be refreshed. |
The 4-Week UGC Optimization Calendar
Here is the operating schedule.

Week 1: Test the Hooks
This first phase goal is to find the opening that earns attention. For everything you do this week, the expected output is to identify the strongest hook candidates.
Launch
☐ 2–4 hook variations ☐ Same body ☐ Same CTA | ☐ Same audience ☐ Same offer ☐ Minimum planned spend per variation |
Measure
Primary | Secondary |
|
|
Do not do
Change targeting halfway through
Rewrite the body immediately
Kill a variation after a few hundred impressions
Week 2: Remove Weak Openers
This week's goal is to focus testing on the strongest creative signal. By the end of the week, you should have one or two hook winners proven by performance data.
Pause | Variations with hook rate below 25% after sufficient initial delivery. |
Increase | Double the budget on the variation with the strongest qualified hook signal, while monitoring downstream metrics. |
Start tracking
CTR
CPC
Landing-page behavior
Week 3: Test the Body
Now freeze the winning hook. You already know the opening earns attention, so keep it unchanged while testing the next variable.
Test Body A vs. Body B, using different approaches such as product demonstration, proof, storytelling, objection handling, or a before-and-after explanation. By the end of the week, you should have winning hook + winning body.
Measure
Hold rate
CTR
Conversion signals
Week 4: Test the CTA and Build the Next Batch
Now test the CTA as a final variable.
CTA A | CTA B | CTA C |
“Try it for yourself.” | “See how it works.” | “Get yours today.” |
Keep the winning hook and body constant, then compile the conversion data.
End-of-month review
The next content brief should be based on these findings:
☐ Best hook ☐ Best body ☐ Best CTA ☐ Best CTR | ☐ Best CPA ☐ Best ROAS ☐ Main reason losers failed ☐ New hypothesis for next batch |
That is how four weeks of testing compounds into a better creative system.
Your Weekly UGC Reporting Template
Keep reporting simple enough that the team will actually use it every week to track these UGC metrics and make better creative decisions:
Variation | Hook Rate | Hold Rate | CTR | CPA | Status | Notes |
Hook 01 | 32% | 18% | 2.1% | $24 | Scaling | Strong opener |
Hook 02 | 21% | 17% | 1.5% | $39 | Iterating | Recut opener |
Hook 03 | 35% | 9% | 0.8% | $51 | Iterating | Body loses attention |
Hook 04 | 18% | 8% | 0.6% | $58 | Killed | Weak from opening |
Create one table per week instead of turning the report into a dashboard with 30 metrics. This will help you to keep the report focused and make the next creative decision obvious.
How to Test Content Without GuessingThe most useful mindset for UGC testing is that every result should create a hypothesis for the next test. A weak hook means testing a new opening, while strong engagement with weak retention points to the content. Strong creative with low CTR may require testing the CTA or offer, while high CPA may mean reviewing the conversion path before blaming the creative. Testing becomes a continuous learning system. You can also use Instagram’s Trial Reels to test UGC before spending your ad budget. You can check the article What Are Trial Reels and Why Are Brands Not Using Them to Test UGC? For the detailed explanation. |
Build a Creative Testing Loop
UGC testing works best when the creative and media teams work as one feedback loop. The media team identifies what works, the creative team turns those insights into new variations, and the next batch tests them. Over time, the brand builds a library of proven hooks, bodies, CTAs, formats, and audience angles.

Masterhooks applies this testing approach by connecting hook development, creator briefs, production, and performance feedback. The goal is not to find one viral video, but to make each batch smarter, each test faster, and each production cycle more focused.
Want a testing system like this built around your own creative?
Want a testing system like this built around your own creative?
Without this process, it’s difficult to analyze poor results. Is the problem with the hook, the content itself, the CTA, or is there simply not enough data? This guide provides a structured testing process so that every result can be used to determine the next steps.
The UGC Testing Rule
Before launching a batch, define what you are testing, how long you will test it, and what result will make you scale, iterate, or stop.
For a clear content A/B test, change one meaningful variable at a time. If Hook A and Hook B use the same body, audience, offer, and CTA, you can more easily see whether the hook caused the performance difference. Changing several elements at once makes the results harder to understand.
How Many UGC Variations Should You Test?
You can start with 2–4 hook variations per batch that is enough to create meaningful contrast without spreading a small budget across too many versions. For the first test:
Variable | Keep consistent |
Audience | Same |
Offer | Same |
Body | Same |
CTA | Same |
Landing page | Same |
Hook | Change this |
Once a winning hook emerges, move to the next layer by testing different bodies, then CTAs. This creates a clear progression and makes it easier to understand what is driving performance.
How Long Should a UGC Test Run?
For day-to-day creative optimization, 48–72 hours is a useful first review window. Use this time to identify early winners and losers, but do not treat 48 hours as a final statistical verdict.
For formal A/B testing, TikTok recommends running Split Tests for at least seven days to collect enough data. A practical approach is 48–72 hours for early creative diagnosis, then longer testing for formal conclusions.
The 4 Layers of UGC Testing
Do not jump straight to CPA because each of these layers answers a different question:
Layer 1: Did the Hook Stop the Scroll?
In the first 6–24 hours, check your 3-second hook rate, calculated as 3-second video views ÷ impressions × 100. This shows whether the opening is strong enough to make people stop and watch.
Working benchmark
Hook rate | Working interpretation | Action |
Below 25% | Weak opening | Rework the first 3 seconds |
25–29% | Baseline | Keep testing |
30%+ | Good | Continue evaluation |
35%+ | Strong scaling signal | Consider additional budget |
These bands are based on current practitioner benchmarks rather than an official Meta standard. Current 2026 sources generally place 25% around the working floor and 30–35% in the stronger range.
If the hook rate is weak, test the first sentence, opening visual, first frame, on-screen text, or initial action before reshooting the entire video. Fix the first three seconds first.
Layer 2: Did the Video Keep Attention?
At 24–48 hours, check whether the body keeps viewers engaged after the hook. A strong opening gets people into the video, while the 15-second hold rate shows whether the content delivers enough value to keep them watching.
Working benchmark
15%+ at 15 seconds = a useful retention signal
Treat these numbers as directional benchmarks, since 2026 datasets vary depending on how 15-second retention is calculated. Some place TikTok In-Feed retention around 12–20% and Meta Feed around 10–18%.
Hook | Hold | Diagnosis |
Low | Low | Opening likely needs work |
High | Low | Body loses the viewer |
High | High | Move to CTR |
Low | High | Re-test the opening before changing the body |
Consistency is the most important part. Use the same calculation and definition every week so your results stay comparable. A strong hold rate also means you do not need to rewrite the entire video if the hook is weak. Change the opening, keep the body, and preserve what already works.
Layer 3: Did the Viewer Want More?
Once the ad has enough impressions, check link CTR. CTR shows whether the creative creates enough interest for viewers to take the next step. For Meta UGC ads in consumer goods, 1–3% can be used as a directional benchmark, but results vary by account, industry, and campaign goal.
If you have a good hook + good hold + weak CTR, the problem may sit further down the ad. Check the product explanation, offer, CTA, value proposition, landing-page expectation, and audience-product fit before replacing the hook. The hook has already shown that it can earn attention.
Layer 4: Did It Actually Convert?
Once you have enough conversion data, look at CPA and ROAS. These are downstream metrics that show whether the creative is driving the business outcome the campaign was built to achieve.
For this testing framework, use 50 conversion events as a minimum working threshold before making a strong CPA or ROAS judgment. This is an operating guideline, not a universal platform requirement, since the right amount of data varies by platform, campaign, and account.
The key principle is not to kill a creative because CPA looks weak before you have enough conversion data to make that result meaningful.
The Testing Decision Tree
Use this after every testing cycle.
Result | Decision | What to do |
Hook <25% | Iterate | Recut first 3 seconds |
Hook 25–30% | Continue testing | Keep gathering signal |
Hook 30%+ | Promising | Evaluate hold and CTR |
Hold weak, hook strong | Iterate body | Keep winning hook |
Hold strong, CTR weak | Iterate CTA/body | Keep winning hook |
CPA within target | Scale | Increase budget gradually |
CPA 50%+ above target after 50 conversions | Pause | Replace or rebuild |
No improvement after 2 iterations | Kill | Move to new concept |
This prevents a common mistake, but you have to make sure to not solve a body problem by throwing away a winning hook.
When Should You Scale?
By using these five conditions together, you can scale when:
☑ Hook rate is 30%+ ☑ Hold rate reaches your defined benchmark ☑ CPA is below target | ☑ Performance remains stable for 3 consecutive days ☑ Conversion data is sufficient to support the decision |
The 35% hook-rate threshold in the original framework can be treated as a stronger scaling signal, with current 2026 practitioner data generally placing 30–35% in the good-to-strong range for Meta video creative.
When Should You Iterate?
Iterate when the problem is isolated.
Scenario 1Hook rate <25% Change only the opening. Try:
Keep the rest of the video. | Scenario 2Hook rate is strong + hold rate is weak The opener worked, but the body did not. Look for:
Keep the winning hook. |
Scenario 3Hook rate is strong + hold rate is strong + CTR is weak The viewer stayed, but they did not want to click. Look at:
This is a different problem from the hook. |
When Should You Kill a Creative?
Use a stricter threshold for deciding when to pause a creative. Pause when CPA is 50% or more above target after 50 conversion events, or when two meaningful iterations show no improvement.
This helps avoid two costly mistakes: killing promising creative too early and wasting media budget on weak creative for too long.
Watch for Creative FatigueA winning UGC ad can eventually stop performing, even if the concept is still strong. The audience may simply have seen it too many times. For high-frequency campaigns, 7–10 days can be a useful reminder to review the creative, but the actual refresh should depend on spend, audience size, frequency, CTR, and CPA. Use the calendar as a reminder, not a rule. Let performance data tell you when the creative needs to be refreshed. |
The 4-Week UGC Optimization Calendar
Here is the operating schedule.
Week 1: Test the Hooks
This first phase goal is to find the opening that earns attention. For everything you do this week, the expected output is to identify the strongest hook candidates.
Launch
☐ 2–4 hook variations ☐ Same body ☐ Same CTA | ☐ Same audience ☐ Same offer ☐ Minimum planned spend per variation |
Measure
Primary | Secondary |
|
|
Do not do
Change targeting halfway through
Rewrite the body immediately
Kill a variation after a few hundred impressions
Week 2: Remove Weak Openers
This week's goal is to focus testing on the strongest creative signal. By the end of the week, you should have one or two hook winners proven by performance data.
Pause | Variations with hook rate below 25% after sufficient initial delivery. |
Increase | Double the budget on the variation with the strongest qualified hook signal, while monitoring downstream metrics. |
Start tracking
CTR
CPC
Landing-page behavior
Week 3: Test the Body
Now freeze the winning hook. You already know the opening earns attention, so keep it unchanged while testing the next variable.
Test Body A vs. Body B, using different approaches such as product demonstration, proof, storytelling, objection handling, or a before-and-after explanation. By the end of the week, you should have winning hook + winning body.
Measure
Hold rate
CTR
Conversion signals
Week 4: Test the CTA and Build the Next Batch
Now test the CTA as a final variable.
CTA A | CTA B | CTA C |
“Try it for yourself.” | “See how it works.” | “Get yours today.” |
Keep the winning hook and body constant, then compile the conversion data.
End-of-month review
The next content brief should be based on these findings:
☐ Best hook ☐ Best body ☐ Best CTA ☐ Best CTR | ☐ Best CPA ☐ Best ROAS ☐ Main reason losers failed ☐ New hypothesis for next batch |
That is how four weeks of testing compounds into a better creative system.
Your Weekly UGC Reporting Template
Keep reporting simple enough that the team will actually use it every week to track these UGC metrics and make better creative decisions:
Variation | Hook Rate | Hold Rate | CTR | CPA | Status | Notes |
Hook 01 | 32% | 18% | 2.1% | $24 | Scaling | Strong opener |
Hook 02 | 21% | 17% | 1.5% | $39 | Iterating | Recut opener |
Hook 03 | 35% | 9% | 0.8% | $51 | Iterating | Body loses attention |
Hook 04 | 18% | 8% | 0.6% | $58 | Killed | Weak from opening |
Create one table per week instead of turning the report into a dashboard with 30 metrics. This will help you to keep the report focused and make the next creative decision obvious.
How to Test Content Without GuessingThe most useful mindset for UGC testing is that every result should create a hypothesis for the next test. A weak hook means testing a new opening, while strong engagement with weak retention points to the content. Strong creative with low CTR may require testing the CTA or offer, while high CPA may mean reviewing the conversion path before blaming the creative. Testing becomes a continuous learning system. You can also use Instagram’s Trial Reels to test UGC before spending your ad budget. You can check the article What Are Trial Reels and Why Are Brands Not Using Them to Test UGC? For the detailed explanation. |
Build a Creative Testing Loop
UGC testing works best when the creative and media teams work as one feedback loop. The media team identifies what works, the creative team turns those insights into new variations, and the next batch tests them. Over time, the brand builds a library of proven hooks, bodies, CTAs, formats, and audience angles.
Masterhooks applies this testing approach by connecting hook development, creator briefs, production, and performance feedback. The goal is not to find one viral video, but to make each batch smarter, each test faster, and each production cycle more focused.
Want a testing system like this built around your own creative?
Related Reading
Related Reading

What Coca-Cola's AI Ad Mistakes Teach Every Brand About Using AI in Advertising
4 min
|
What Coca-Cola's AI Ad Mistakes Teach Every Brand About Using AI in Advertising
What Coca-Cola's AI ads reveal about brand heritage, consumer trust, creative risk, and when AI advertising makes strategic sense.
4 min
|

How AI Ads Can Lower Your CPA: The Data Behind Smarter Advertising
4 min
|
How AI Ads Can Lower Your CPA: The Data Behind Smarter Advertising
See how AI advertising can lower CPA and improve ROAS through smarter bidding, targeting, creative testing, and real-time budget optimization.
4 min
|

What Are AI Ads? How Brands Are Using Artificial Intelligence to Create, Target, and Scale Advertising in 2026
4 min
|
What Are AI Ads? How Brands Are Using Artificial Intelligence to Create, Target, and Scale Advertising in 2026
Learn what AI advertising is, how AI creates and targets ads, and how brands use it to test, optimize, and scale campaigns in 2026.
4 min
|


Need help scaling?
Book a strategy call with our expert team to audit your current UGC setup.